SUMMARY
- Unit economics for startups comes down to three numbers: CAC, margin-based LTV and CAC payback. Calculate all three before you spend more on growth.
- In our ₹ example, a 3.3:1 revenue ratio shrinks to 1.4:1 once shipping, fees and returns are counted, with payback at month eight.
- Track contribution margin by channel and split COD from prepaid orders. Payback decides whether your cash lasts long enough for the ratio to matter.
Is a ₹900 customer acquisition cost too high? Founders ask us this a lot, and it’s the wrong question. ₹900 is cheap for a customer who leaves ₹3,000 of profit behind and ruinous for one who leaves ₹600.
That gap is what unit economics for startups measures. It’s the profit or loss on one customer, or one order, after every cost that grows when you sell one more. Get it wrong and growth just makes the loss bigger.
Below you’ll find the three formulas, one worked ₹ example, the leaks that hit Indian brands hardest, and where the famous benchmarks actually come from.
The three numbers that matter
Start with these, in this order:
- CAC (customer acquisition cost): sales and marketing spend divided by new customers won in the same period. Count creative, agency fees and sales salaries, not just the ad platform bill.
- LTV (lifetime value): contribution margin per order multiplied by the orders a customer places in a fixed window. Twelve months is a sensible start. For a subscription, use monthly revenue per customer times gross margin, divided by monthly churn.
- CAC payback: how long until a customer’s cumulative margin covers their CAC. For a subscription, divide CAC by monthly revenue per customer times gross margin.
The LTV:CAC ratio is simply LTV divided by CAC. The ratio tells you how big the prize is. Payback tells you how fast the cash comes back.
One ₹ example, two very different answers
Take a made-up D2C skincare brand. These are illustrative numbers, not a real company.
| Per order | ₹ |
|---|---|
| Order value | 1,000 |
| Product cost (COGS) | -400 |
| Shipping | -80 |
| Payment gateway (2%) | -20 |
| Packaging | -30 |
| Returns and RTO leakage | -60 |
| Contribution margin | 410 |
The RTO line assumes one order in five comes back, at roughly ₹300 each in forward and reverse shipping, packaging and damage. That’s ₹60 spread across every order. Assume a customer orders three times in 12 months, at months 0, 4 and 8, and CAC is ₹900.
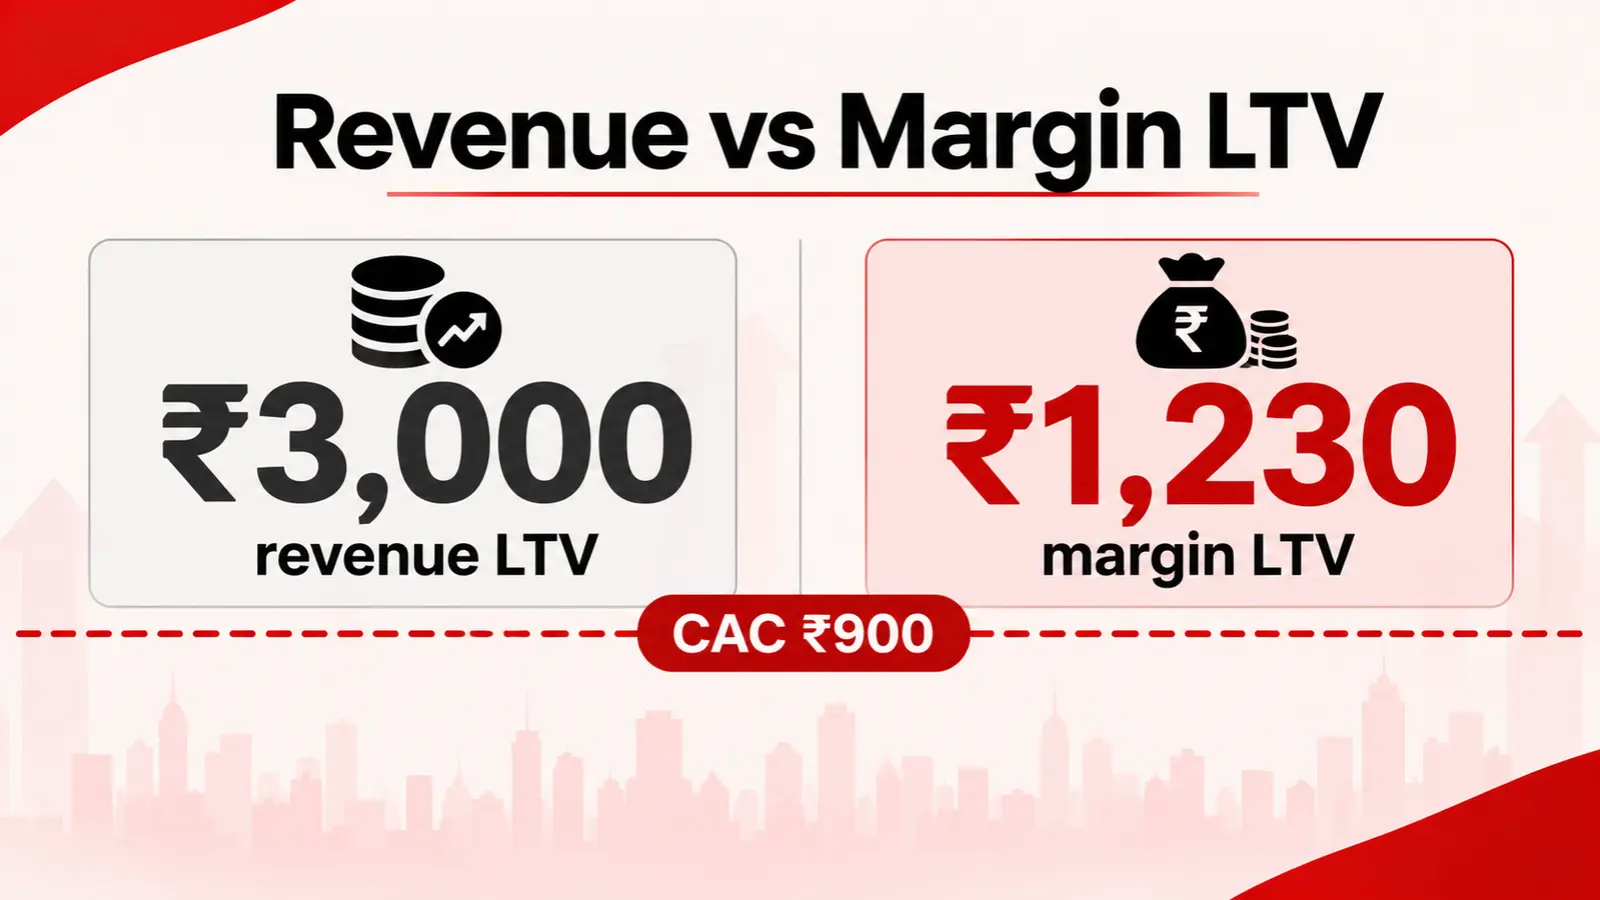
The revenue version of LTV is ₹1,000 times three orders, so ₹3,000. Divide by ₹900 and you get 3.3:1. It looks healthy.
Now use margin. ₹410 times three orders is ₹1,230, and the ratio drops to 1.4:1. Cumulative margin only passes ₹900 on the third order, so payback is month eight. Same customers, same business. One calculation says scale, the other says fix the model first.
Same customers, two answers: 3.3:1 or 1.4:1
12-month LTV of an illustrative D2C customer who orders three times, against a ₹900 CAC
Illustrative example by StartupIndiaX, not a real company. Margin-based LTV = ₹410 contribution per order x 3 orders.
StartupIndiaX | www.startupindiax.com
Where Indian numbers leak
Indian D2C has a few cost lines that Western templates barely include.
RTO and COD. E-commerce platform Base reports typical RTO rates in India of 20 to 30%, against 8 to 12% globally, with COD making up around 45% of D2C orders. Another Base analysis puts RTO at up to 26% for COD orders and under 2% for prepaid. COD also carries a handling fee, which The D2C Pulse puts at ₹15 to ₹30 per order.
ROAS that hides the problem. Base also notes that a 3x ROAS can look healthy until RTO, platform fees and discounts come out. That’s why it argues for capping CAC on contribution margin, not ROAS.
Blended numbers. Base says investors want a channel-wise P&L, not one blended figure. That matters now: Entrackr reports D2C startups raised around $200 Mn in October, nearly 30% of all funding, across 36 of 108 deals. More cheques are heading to D2C, and the founders who can show margin by channel will answer the hard questions faster.

What good looks like, and where the benchmarks come from
The 3:1 ratio and 12-month payback you see everywhere trace back to David Skok’s SaaS Metrics 2.0. Two details usually get lost. His LTV already had margin taken out, so 3:1 meant three rupees of profit per rupee spent. And several analysts note the rule assumes stable churn and wasn’t meant for companies still finding product-market fit.
For Indian D2C, eChai says many brands run healthy at 1.5 to 2.5:1 in the early years while repeat behaviour is still forming. It suggests recovering CAC within six months, because otherwise you’re financing growth from your own working capital. Treat all of these as rules of thumb, not standards.
Payback is the number that protects your cash. A strong ratio with a 24-month payback means two years of funding customers before they pay you back.
Three levers, one combined result
Back to the skincare brand. We change one thing at a time, then all three together.
| Scenario | Contribution per order | 12-month LTV | LTV:CAC | Payback |
|---|---|---|---|---|
| Today | ₹410 | ₹1,230 | 1.4:1 | Month 8 |
| Push prepaid, halving RTO leakage to ₹30 | ₹440 | ₹1,320 | 1.5:1 | Month 8 |
| Bundle lifts order value to ₹1,200 | ₹526 | ₹1,578 | 1.8:1 | Month 4 |
| CAC falls 10% to ₹810 | ₹410 | ₹1,230 | 1.5:1 | Month 4 |
| All three together | ₹556 | ₹1,668 | 2.1:1 | Month 4 |
The bundle assumes product cost stays at 40% of order value. The combined result sits inside eChai’s early-stage range, with payback inside six months.
The SaaS version in one paragraph
Suppose a B2B SaaS startup charges ₹5,000 a month per customer at 80% gross margin, loses 3% of customers a month, and spends ₹40,000 to win each one. LTV is 5,000 x 0.8 / 0.03, about ₹1.33 lakh. The ratio is 3.3:1 and payback is 10 months. The formula assumes churn stays stable, so recheck it once real cohorts arrive.
So, is growth worth it?
Run a three-part test before you raise your ad budget. Is your ratio inside the range for your model and stage? Does payback fit inside your cash runway? Is margin positive in each channel, not only on average?
Read More: 10 Startup Metrics for Founders That Tell You If You’re Ready to Raise
If one answer is no, fix it before you spend. Then check how long your cash lasts. Our free Startup Runway Calculator turns cash and burn into a number of months, and the rest of the Founder Toolkit covers valuation, dilution and equity.
Funding is lumpy, too. Entrackr counted 12 startups raising $31.3 Mn in the week of Nov 9 to 14, 2026, nearly 88% below the week before.
Read More: How to Raise Startup Funding in India in 2026
Three things to carry out of this guide:
- Calculate LTV on contribution margin, never on revenue.
- Read payback next to the ratio, because payback protects cash.
- Split COD from prepaid and track margin by channel.
Which number is hardest for you to pin down, CAC or repeat orders? Tell us in the comments, and share this with a co-founder who still tracks ROAS alone.
FAQs
What is unit economics for startups?
Unit economics is the profit or loss on one unit of your business, usually one customer or one order, after the costs that grow with each sale. It tells you whether growth creates value or just adds cost.
What is a good LTV:CAC ratio?
The common benchmark is 3:1, from David Skok’s SaaS work, with LTV counted after margin. eChai says many Indian D2C brands run healthy at 1.5 to 2.5:1 early on. Read the ratio alongside payback.
How do you calculate CAC payback?
For a subscription, divide CAC by monthly revenue per customer times gross margin. For repeat-purchase brands, count when a customer’s cumulative contribution margin first passes CAC. Many sources suggest under 12 months, and eChai suggests six for D2C.
Why use contribution margin instead of revenue for LTV?
Revenue ignores shipping, fees, returns and COD costs, so it overstates what a customer is worth. In our example, revenue gives 3.3:1 while contribution margin gives 1.4:1 for the same customers.
Why do COD and RTO matter so much in India?
Base reports Indian RTO rates of 20 to 30% against 8 to 12% globally, with COD around 45% of D2C orders. Each failed delivery adds shipping, packaging and damage costs with no revenue to offset them.